#include <plot.h>
Public Member Functions | |
| PlotWrapper () | |
| Constructor. More... | |
| ~PlotWrapper () | |
| Destructor must delete target plots. More... | |
| const PlotWrapper & | operator= (const PlotWrapper &oth) |
| size_t | numPlots () const |
| void | getPlotIDs (std::vector< unsigned int > &ids) const |
| std::string | getTitle (size_t plotId) const |
| void | setEnableHighlightOverlap (bool enable=true) |
| size_t | getParentType (size_t plotId) const |
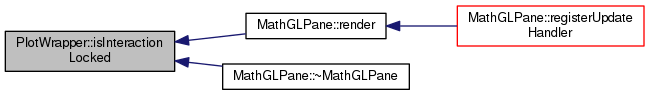
| bool | isInteractionLocked () const |
| void | lockInteraction (bool lock=true) |
| bool | hasChanged () const |
| Has the contents of the plot changed since the last call to resetChange? More... | |
| void | resetChange () |
| void | clear (bool preserveVisibility=false) |
| Erase all the plot data. More... | |
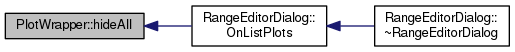
| void | hideAll () |
| Hide all plots (sets all visibility to false) More... | |
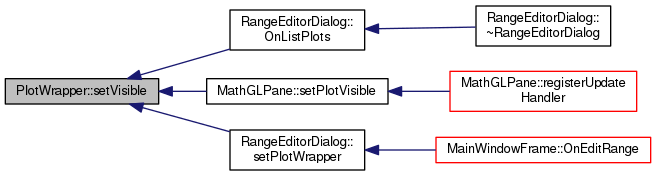
| void | setVisible (unsigned int uniqueID, bool isVisible=true) |
| Set the visibilty of a plot, based upon its uniqueID. More... | |
| void | scanBounds (float &xMin, float &xMax, float &yMin, float &yMax) const |
| Get the bounds for the plot. More... | |
| void | drawPlot (mglGraph *graph, bool &usingLogMode) const |
| void | setStrings (unsigned int plotID, const char *x, const char *y, const char *t) |
| Set the X Y and title strings. More... | |
| void | setStrings (unsigned int plotID, const std::string &x, const std::string &y, const std::string &t) |
| const void * | getParent (unsigned int plotID) |
| Get the parent object fo rthis plot. More... | |
| unsigned int | getParentIndex (unsigned int plotId) const |
| void | setTraceStyle (unsigned int plotID, unsigned int mode) |
| Set the plotting mode. More... | |
| void | setColours (unsigned int plotID, float rN, float gN, float bN) |
| Set the plot colours. More... | |
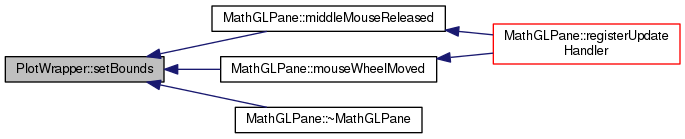
| void | setBounds (float xMin, float xMax, float yMin, float yMax) |
| Set the bounds on the plot. More... | |
| void | getBounds (float &xMin, float &xMax, float &yMin, float &yMax) const |
| Get the bounds for the plot. More... | |
| void | resetBounds () |
| Automatically use the data limits to compute bounds. More... | |
| unsigned int | getNumVisible () const |
| Get the number of visible plots. More... | |
| unsigned int | getNumTotal () const |
| Get the number of visible plots. More... | |
| bool | isPlotVisible (unsigned int plotID) const |
| Returns true if plot is visible, based upon its uniqueID. More... | |
| void | getVisibleIDs (std::vector< unsigned int > &plotID) const |
| void | disableUserBounds () |
| Disable user bounds. More... | |
| void | disableUserAxisBounds (bool xAxis) |
| Disable user axis bounds along one axis only. More... | |
| void | bestEffortRestoreVisibility () |
| Do our best to restore the visibility of the plot to what it was. More... | |
| void | setLegendVisible (bool vis) |
| Set whether to enable the legend or not. More... | |
| bool | getLegendVisible () const |
| unsigned int | addPlot (PlotBase *plot) |
| Add a plot to the list of available plots. Control of the pointer becomes. More... | |
| bool | getRegionIdAtPosition (float px, float py, unsigned int &plotId, unsigned int ®ionID) const |
| Get the ID (return value) and the contents of the plot region at the given position. More... | |
| void | getRegion (unsigned int plotId, unsigned int regionId, PlotRegion &r) const |
| void | getRegions (std::vector< std::pair< size_t, std::vector< PlotRegion > > > ®ions, bool visibleOnly=true) const |
| void | getRegionOverlaps (std::vector< std::pair< size_t, size_t > > &ids, std::vector< std::pair< float, float > > &coords) const |
| void | getRawData (std::vector< std::vector< std::vector< float > > > &data, std::vector< std::vector< std::string > > &labels) const |
| Retrieve the raw data associated with the selected plots. More... | |
| unsigned int | getPlotMode (unsigned int plotId) const |
| obtain the type of a plot, given the plot's uniqueID More... | |
| unsigned int | getVisibleMode () const |
| void | findRegionLimit (unsigned int plotId, unsigned int regionId, unsigned int movementType, float &maxX, float &maxY) const |
| Obtain limit of motion for a given region movement type. More... | |
| void | moveRegion (unsigned int plotID, unsigned int regionId, bool regionSelfUp, unsigned int movementType, float newX, float newY) const |
| Pass the region movement information to the parent filter object. More... | |
| void | switchOutRegionParent (std::map< const RangeFileFilter *, RangeFile > &switchMap) |
| void | setRegionGroup (size_t plotId, RegionGroup &r) |
| void | overrideLastVisible (std::vector< std::pair< const void *, unsigned int > > &overridden) |
Public Attributes | |
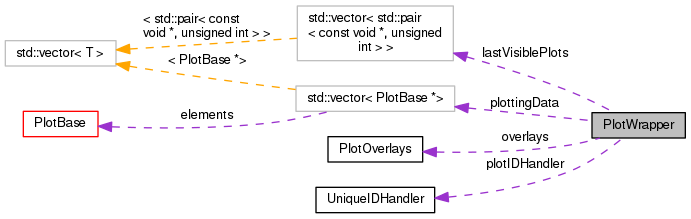
| PlotOverlays | overlays |
Protected Member Functions | |
| void | getAppliedBounds (mglPoint &min, mglPoint &max) const |
Protected Attributes | |
| bool | plotChanged |
| Has the plot changed since we last rendered it? More... | |
| std::vector< PlotBase * > | plottingData |
| Elements of the plot. More... | |
| std::vector< std::pair< const void *, unsigned int > > | lastVisiblePlots |
| Data regarding plots were visible previously. More... | |
| UniqueIDHandler | plotIDHandler |
| bool | applyUserBounds |
| Use user-specified bounding values? More... | |
| float | xUserMin |
| User mininum bounds. More... | |
| float | yUserMin |
| float | xUserMax |
| User maximum bounds. More... | |
| float | yUserMax |
| bool | drawLegend |
| Switch to enable or disable drawing of the plot legend. More... | |
| bool | interactionLocked |
| is user interaction with the plot supposed to be locked? More... | |
| bool | highlightRegionOverlaps |
| Do we want to highlight positions where regions overlap? More... | |
Constructor & Destructor Documentation
◆ PlotWrapper()
| PlotWrapper::PlotWrapper | ( | ) |
Constructor.
◆ ~PlotWrapper()
| PlotWrapper::~PlotWrapper | ( | ) |
Destructor must delete target plots.
Member Function Documentation
◆ addPlot()
| unsigned int PlotWrapper::addPlot | ( | PlotBase * | plot | ) |
Add a plot to the list of available plots. Control of the pointer becomes.
◆ bestEffortRestoreVisibility()
| void PlotWrapper::bestEffortRestoreVisibility | ( | ) |
Do our best to restore the visibility of the plot to what it was.
◆ clear()
| void PlotWrapper::clear | ( | bool | preserveVisibility = false | ) |
Erase all the plot data.
◆ disableUserAxisBounds()
| void PlotWrapper::disableUserAxisBounds | ( | bool | xAxis | ) |
Disable user axis bounds along one axis only.
References ASSERT.
Referenced by MathGLPane::mouseDoubleLeftClick().

◆ disableUserBounds()
|
inline |
Disable user bounds.
Referenced by MathGLPane::mouseDoubleLeftClick().

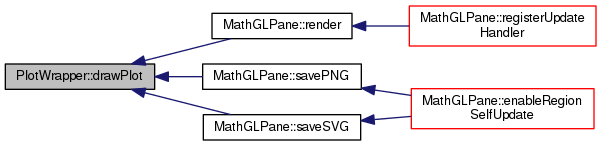
◆ drawPlot()
| void PlotWrapper::drawPlot | ( | mglGraph * | graph, |
| bool & | usingLogMode | ||
| ) | const |
References ASSERT, Plot1D::drawPlot(), Plot2DFunc::drawPlot(), Plot1D::drawRegions(), PlotBase::getColour(), PlotBase::getMode(), PlotBase::getTitle(), mglColourCode(), PLOT_2D_DENS, PLOT_MODE_1D, PLOT_MODE_2D, PLOT_MODE_ENUM_END, PLOT_MODE_MIXED, TRANS, PlotBase::visible, and WARN.
Referenced by MathGLPane::render(), MathGLPane::savePNG(), and MathGLPane::saveSVG().
◆ findRegionLimit()
| void PlotWrapper::findRegionLimit | ( | unsigned int | plotId, |
| unsigned int | regionId, | ||
| unsigned int | movementType, | ||
| float & | maxX, | ||
| float & | maxY | ||
| ) | const |
Obtain limit of motion for a given region movement type.
Referenced by MathGLPane::getErrString().

◆ getAppliedBounds()
|
protected |
References ASSERT, and mglFloatTooClose().
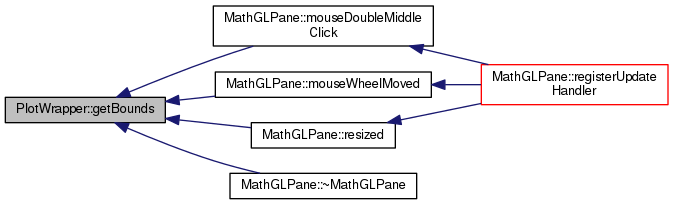
◆ getBounds()
| void PlotWrapper::getBounds | ( | float & | xMin, |
| float & | xMax, | ||
| float & | yMin, | ||
| float & | yMax | ||
| ) | const |
Get the bounds for the plot.
References ASSERT.
Referenced by MathGLPane::mouseDoubleMiddleClick(), MathGLPane::mouseWheelMoved(), MathGLPane::resized(), and MathGLPane::~MathGLPane().
◆ getLegendVisible()
|
inline |
References PlotRegion::r.
◆ getNumTotal()
|
inline |
Get the number of visible plots.
Referenced by MathGLPane::~MathGLPane().

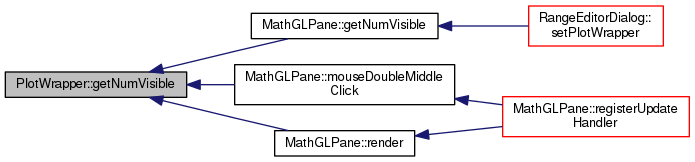
◆ getNumVisible()
| unsigned int PlotWrapper::getNumVisible | ( | ) | const |
Get the number of visible plots.
Referenced by MathGLPane::getNumVisible(), MathGLPane::mouseDoubleMiddleClick(), and MathGLPane::render().
◆ getParent()
|
inline |
◆ getParentIndex()
|
inline |
References ASSERT.
◆ getParentType()
| size_t PlotWrapper::getParentType | ( | size_t | plotId | ) | const |

◆ getPlotIDs()
| void PlotWrapper::getPlotIDs | ( | std::vector< unsigned int > & | ids | ) | const |

◆ getPlotMode()
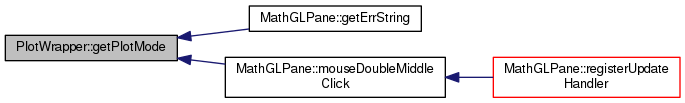
| unsigned int PlotWrapper::getPlotMode | ( | unsigned int | plotId | ) | const |
obtain the type of a plot, given the plot's uniqueID
References ASSERT.
Referenced by MathGLPane::getErrString(), and MathGLPane::mouseDoubleMiddleClick().
◆ getRawData()
| void PlotWrapper::getRawData | ( | std::vector< std::vector< std::vector< float > > > & | data, |
| std::vector< std::vector< std::string > > & | labels | ||
| ) | const |
Retrieve the raw data associated with the selected plots.
References ASSERT, PLOT_MODE_1D, PLOT_MODE_2D, PLOT_MODE_ENUM_END, and PLOT_MODE_MIXED.
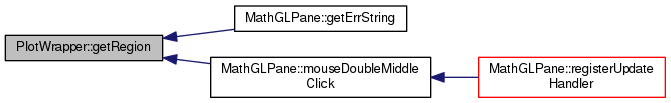
◆ getRegion()
| void PlotWrapper::getRegion | ( | unsigned int | plotId, |
| unsigned int | regionId, | ||
| PlotRegion & | r | ||
| ) | const |
Referenced by MathGLPane::getErrString(), and MathGLPane::mouseDoubleMiddleClick().
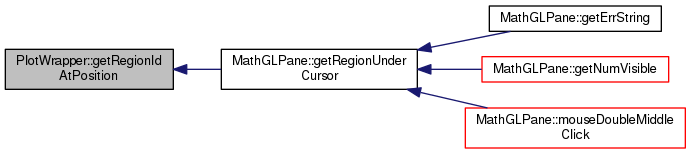
◆ getRegionIdAtPosition()
| bool PlotWrapper::getRegionIdAtPosition | ( | float | px, |
| float | py, | ||
| unsigned int & | plotId, | ||
| unsigned int & | regionID | ||
| ) | const |
Get the ID (return value) and the contents of the plot region at the given position.
Referenced by MathGLPane::getRegionUnderCursor().
◆ getRegionOverlaps()
| void PlotWrapper::getRegionOverlaps | ( | std::vector< std::pair< size_t, size_t > > & | ids, |
| std::vector< std::pair< float, float > > & | coords | ||
| ) | const |
References RegionGroup::getOverlaps().
◆ getRegions()
| void PlotWrapper::getRegions | ( | std::vector< std::pair< size_t, std::vector< PlotRegion > > > & | regions, |
| bool | visibleOnly = true |
||
| ) | const |
References PlotBase::regionGroup, RegionGroup::regions, and PlotBase::visible.
Referenced by RangeEditorDialog::setPlotWrapper().

◆ getTitle()
| std::string PlotWrapper::getTitle | ( | size_t | plotId | ) | const |

◆ getVisibleIDs()
| void PlotWrapper::getVisibleIDs | ( | std::vector< unsigned int > & | plotID | ) | const |
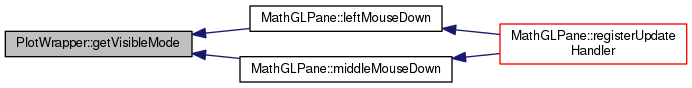
◆ getVisibleMode()
| unsigned int PlotWrapper::getVisibleMode | ( | ) | const |
References ASSERT, PLOT_MODE_ENUM_END, and PLOT_MODE_MIXED.
Referenced by MathGLPane::leftMouseDown(), and MathGLPane::middleMouseDown().
◆ hasChanged()
|
inline |
Has the contents of the plot changed since the last call to resetChange?
Referenced by MathGLPane::render().

◆ hideAll()
| void PlotWrapper::hideAll | ( | ) |
Hide all plots (sets all visibility to false)
Referenced by RangeEditorDialog::OnListPlots().
◆ isInteractionLocked()
|
inline |
Referenced by MathGLPane::render(), and MathGLPane::~MathGLPane().
◆ isPlotVisible()
| bool PlotWrapper::isPlotVisible | ( | unsigned int | plotID | ) | const |
Returns true if plot is visible, based upon its uniqueID.
◆ lockInteraction()
|
inline |
◆ moveRegion()
| void PlotWrapper::moveRegion | ( | unsigned int | plotID, |
| unsigned int | regionId, | ||
| bool | regionSelfUp, | ||
| unsigned int | movementType, | ||
| float | newX, | ||
| float | newY | ||
| ) | const |
Pass the region movement information to the parent filter object.
Referenced by MathGLPane::leftMouseReleased().

◆ numPlots()
|
inline |
◆ operator=()
| const PlotWrapper & PlotWrapper::operator= | ( | const PlotWrapper & | oth | ) |
References applyUserBounds, drawLegend, highlightRegionOverlaps, interactionLocked, lastVisiblePlots, plotChanged, plotIDHandler, plottingData, xUserMax, xUserMin, yUserMax, and yUserMin.
◆ overrideLastVisible()
| void PlotWrapper::overrideLastVisible | ( | std::vector< std::pair< const void *, unsigned int > > & | overridden | ) |
◆ resetBounds()
| void PlotWrapper::resetBounds | ( | ) |
Automatically use the data limits to compute bounds.
◆ resetChange()
|
inline |
References plotID().
Referenced by MathGLPane::render().

◆ scanBounds()
| void PlotWrapper::scanBounds | ( | float & | xMin, |
| float & | xMax, | ||
| float & | yMin, | ||
| float & | yMax | ||
| ) | const |
Get the bounds for the plot.
References ASSERT.
Referenced by MathGLPane::mouseWheelMoved().

◆ setBounds()
| void PlotWrapper::setBounds | ( | float | xMin, |
| float | xMax, | ||
| float | yMin, | ||
| float | yMax | ||
| ) |
Set the bounds on the plot.
References ASSERT.
Referenced by MathGLPane::middleMouseReleased(), MathGLPane::mouseWheelMoved(), and MathGLPane::~MathGLPane().
◆ setColours()
| void PlotWrapper::setColours | ( | unsigned int | plotID, |
| float | rN, | ||
| float | gN, | ||
| float | bN | ||
| ) |
Set the plot colours.
◆ setEnableHighlightOverlap()
|
inline |

◆ setLegendVisible()
|
inline |
Set whether to enable the legend or not.
Referenced by MathGLPane::setLegendVisible().

◆ setRegionGroup()
| void PlotWrapper::setRegionGroup | ( | size_t | plotId, |
| RegionGroup & | r | ||
| ) |

◆ setStrings() [1/2]
| void PlotWrapper::setStrings | ( | unsigned int | plotID, |
| const char * | x, | ||
| const char * | y, | ||
| const char * | t | ||
| ) |
Set the X Y and title strings.
◆ setStrings() [2/2]
| void PlotWrapper::setStrings | ( | unsigned int | plotID, |
| const std::string & | x, | ||
| const std::string & | y, | ||
| const std::string & | t | ||
| ) |
◆ setTraceStyle()
| void PlotWrapper::setTraceStyle | ( | unsigned int | plotID, |
| unsigned int | mode | ||
| ) |
Set the plotting mode.
References ASSERT, and PLOT_TYPE_ENUM_END.
◆ setVisible()
| void PlotWrapper::setVisible | ( | unsigned int | uniqueID, |
| bool | isVisible = true |
||
| ) |
Set the visibilty of a plot, based upon its uniqueID.
Referenced by RangeEditorDialog::OnListPlots(), MathGLPane::setPlotVisible(), and RangeEditorDialog::setPlotWrapper().
◆ switchOutRegionParent()
| void PlotWrapper::switchOutRegionParent | ( | std::map< const RangeFileFilter *, RangeFile > & | switchMap | ) |
References PlotRegion::ACCESS_MODE_RANGEFILE, ASSERT, FILTER_TYPE_RANGEFILE, Filter::getType(), PlotBase::regionGroup, and RegionGroup::regions.
Referenced by RangeEditorDialog::setPlotWrapper().

Member Data Documentation
◆ applyUserBounds
|
protected |
Use user-specified bounding values?
Referenced by operator=().
◆ drawLegend
|
protected |
Switch to enable or disable drawing of the plot legend.
Referenced by operator=().
◆ highlightRegionOverlaps
|
protected |
Do we want to highlight positions where regions overlap?
Referenced by operator=().
◆ interactionLocked
|
protected |
is user interaction with the plot supposed to be locked?
Referenced by operator=().
◆ lastVisiblePlots
|
protected |
Data regarding plots were visible previously.
Referenced by operator=().
◆ overlays
| PlotOverlays PlotWrapper::overlays |
◆ plotChanged
|
protected |
Has the plot changed since we last rendered it?
Referenced by operator=().
◆ plotIDHandler
|
protected |
Referenced by operator=().
◆ plottingData
|
protected |
Elements of the plot.
Referenced by operator=().
◆ xUserMax
|
protected |
User maximum bounds.
Referenced by operator=().
◆ xUserMin
|
protected |
User mininum bounds.
Referenced by operator=().
◆ yUserMax
|
protected |
Referenced by operator=().
◆ yUserMin
|
protected |
Referenced by operator=().
The documentation for this class was generated from the following files: